Capacity in Asia-Pacific rose 167% and load factor surged to 83%
It looks like the first month of the year fared very well for flight traffic around the world, as some countries inch closer to reaching pre-pandemic levels of traffic and tourism. This was backed by the International Air Transport Association (IATA), who announced that the recovery in air travel demand is continuing in 2023, based on January traffic results.
IATA represents some 300 airlines comprising 83% of global air traffic. IATA statistics cover international and domestic scheduled air traffic for IATA member and non-member airlines.
For context, last year, total passenger traffic market shares by region of carriers in terms of RPK are: Asia-Pacific 22.1%, Europe 30.7%, North America 28.9%, Middle East 9.8%, Latin America 6.4%, and Africa 2.1%.
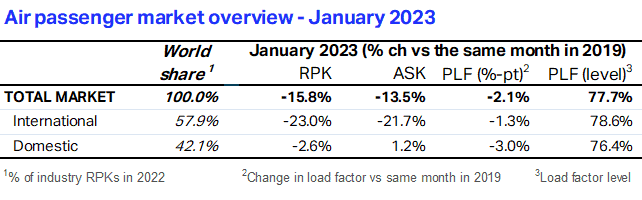
Helped by the swift reopening of China from Covid-19 restrictions, the annual growth of global domestic RPKs accelerated to 32.7% in January, reaching 97.4% of pre-pandemic levels. International passenger traffic also continued its steady growth to reach 77.0% of January 2019 levels.
Here’s a big picture snapshot of January’s report:
- Total traffic in January 2023 (measured in revenue passenger kilometers or RPKs) rose 67.0% compared to January 2022. Globally, traffic is now at 84.2% of January 2019 levels.
- Domestic traffic for January 2023 rose 32.7% compared to the year-ago period, helped by the lifting of the zero-COVID policy in China. Total January 2023 domestic traffic was at 97.4% of the January 2019 level.
- International traffic climbed 104.0% versus January 2022 with all markets recording strong growth, led by carriers in the Asia-Pacific region. International RPKs reached 77.0% of January 2019 levels.
As mentioned, a key factor in travel recovery this year is the loosening of movement restrictions in China, something that the travel and hospitality industry has been keeping a keen eye on.
Willie Walsh, IATA’s Director General said, “Air travel demand is off to a very healthy start in 2023. The rapid removal of COVID-19 restrictions for Chinese domestic and international travel bodes well for the continued strong industry recovery from the pandemic throughout the year. And, importantly, we have not seen the many economic and geopolitical uncertainties of the day dampening demand for travel.”
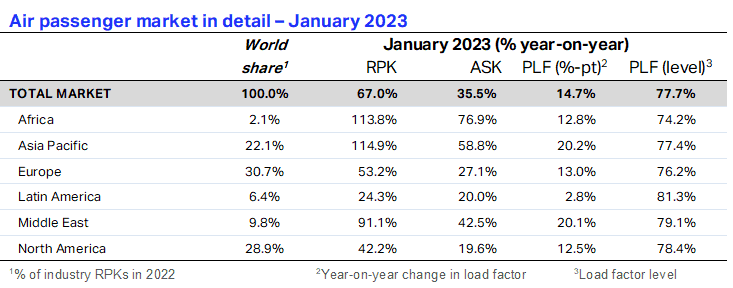
Given the size of China’s domestic market – accounting for 9.8% of total industry RPKs and 27.1% of total domestic RPKs in 2019 – its recent growth in traffic had a substantial impact on global RPKs. Total domestic RPKs recovered to 97.4% of their 2019 levels in January. In YoY terms, domestic RPKs and ASKs increased 67.0% and 35.5%, respectively.
Other monitored markets of the Asia Pacific region sustained their past year’s recovery momentum in January, and continued to approach pre-pandemic domestic traffic levels.
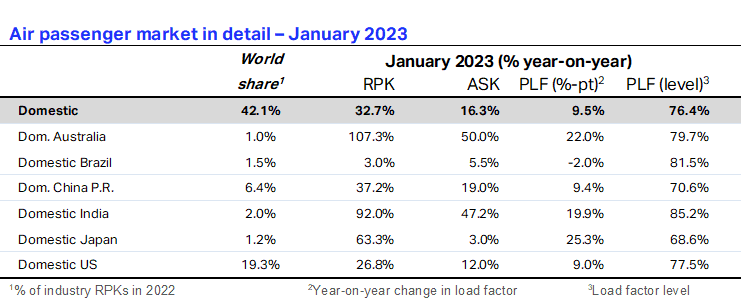
For example, in India, domestic RPKs were 1.3% below January 2019 levels and grew 92.0% YoY. Japan and Australia saw 63.3% and 107.3% YoY domestic traffic growth in January, respectively, recovering their RPKs to 89.7% and 88.8% of 2019 levels. Overall, domestic RPKs carried by airlines of the Asia Pacific region grew 47.8% YoY in January, and currently sit 11.0% under 2019 levels.
“With strong travel demand continuing through the traditionally slower winter season in the Northern Hemisphere, the stage is set for an even busier spring and summer,” added Walsh. “At a time when many are just beginning to enjoy their newly restored travel freedoms, it is especially disappointing to see the Dutch government making plans to limit their movements by unilaterally and unjustly reducing operations at Schiphol Airport.”
International Passenger Markets
- Asia-Pacific airlines posted a 376.3% increase in January traffic compared to January 2022, by far the strongest year-over-year rate among the regions, but off of a very low base when much of the region was still closed to travel. Capacity rose 167.1% and the load factor increased 36.6 percentage points to 83.3%, the highest among the regions.Although demand between the Asia Pacific region and the rest of the world lags in terms of recovery rate, the most recent developments support a positive outlook for the region.
- European carriers saw a 60.6% traffic rise versus January 2022. Capacity increased 30.1%, and load factor rose 14.2 percentage points to 75.0%.
- Middle Eastern airlines’ January traffic rose 97.7% compared to January a year ago. Capacity increased 45.9% and load factor climbed 20.8 percentage points to 79.2%.
- North American carriers reported an 82.4% traffic increase in January versus the 2022 period. Capacity rose 37.3%, and load factor climbed 19.7 percentage points to 79.6%.
- Latin American airlines had a 46.8% traffic increase compared to the same month in 2022. January capacity climbed 34.3% and load factor rose 7.1 percentage points to 82.7%, the second highest among the regions.
- African airlines’ traffic rose 124.8% in January 2023 versus a year ago. January capacity was up 82.5% and load factor climbed 13.9 percentage points to 73.7%, the lowest among regions.
Domestic Passenger Markets
Australia’s domestic traffic rose 107.3% in January compared to a year ago and now stands at 88.8% of pre-pandemic levels
China’s domestic RPKs rose 37.2% in January, the first month over month annual increase since August 2022 and is now at 86.3% of January 2019 levels.