The International Air Transport Association (IATA) has released its latest data for March 2024, revealing a surge in global passenger demand.
Here are the key highlights:
Total demand, measured in revenue passenger kilometers (RPKs), increased by 13.8% compared to March 2023. Total capacity, measured in available seat kilometers (ASK), also saw a substantial rise of 12.3% year-on-year. The load factor for March reached 82.0%, marking a 1.0 percentage point increase compared to March 2023.
International demand
International demand experienced a robust growth of 18.9% compared to March 2023. Capacity increased by 18.8% year-on-year, leading to an improved load factor of 81.6%, up by 0.1 percentage points compared to March 2023.
Domestic demand
Domestic demand saw a 6.6% increase compared to March 2023. Capacity increased by 3.4% year-on-year, resulting in a load factor of 82.6%, up by 2.5 percentage points compared to March 2023.
Willie Walsh, Director General of IATA, commented on the findings, saying, “Demand for travel is strong, and there is every indication that this trend will continue into the peak Northern Summer travel season. It is critical that we have the capacity to meet this demand and ensure a hassle-free travel experience for passengers.”
Walsh emphasised the importance of addressing supply chain issues and ensuring that airports and air traffic management are fully staffed and operating at maximum efficiency. He noted that while airlines are prepared to assist customers with care and support during operational issues, they are frustrated with bearing the costs of delays and cancellations resulting from poor preparation in other parts of the value chain.
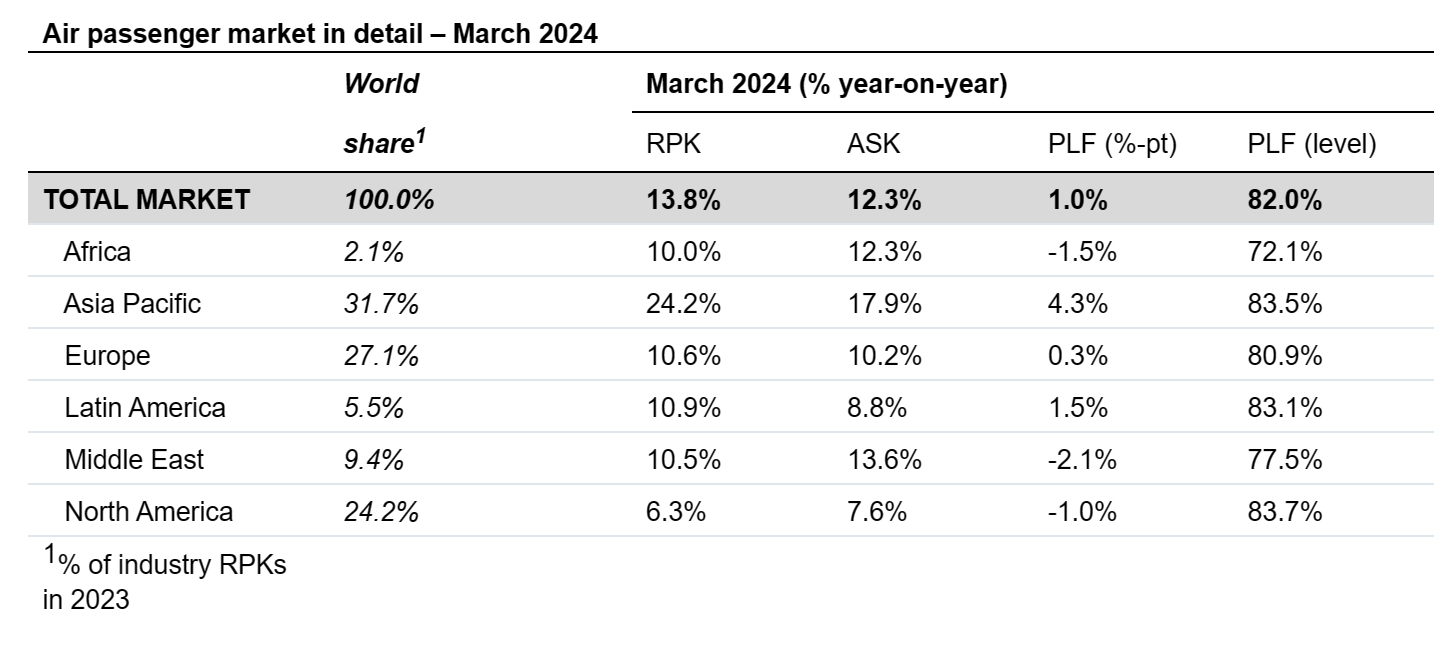
Regional breakdown – International passenger markets
All regions showed strong growth for international passenger markets in March 2024 compared to March 2023, although load factor performance varied across regions.
Asia-Pacific
Asia-Pacific airlines continued to lead the way, experiencing a 38.5% year-on-year increase in demand. Capacity increased by 37.4% year-on-year, with a load factor of 85.6%, the highest among all regions.
Europe
European carriers saw an 11.6% year-on-year increase in demand. Capacity increased by 11.4% year-on-year, with a load factor of 79.9%, up by just 0.1 percentage points compared to March 2023.
Middle East
Middle Eastern airlines saw a 10.8% year-on-year increase in demand. Capacity increased by 13.9% year-on-year, but the load factor fell by 2.1 percentage points to 77.5% compared to March 2023.
North America
North American carriers experienced a 14.5% year-on-year increase in demand. Capacity increased by 14.8% year-on-year, with a load factor of 84.7%, down by 0.2 percentage points compared to March 2023.
Latin America
Latin American airlines saw a substantial 19.7% year-on-year increase in demand. Capacity climbed by 18.3% year-on-year, with a load factor of 84.3%, up by 0.9 percentage points compared to March 2023.
Africa
African airlines experienced an 8.1% year-on-year increase in demand. Capacity was up by 11.0% year-on-year, but the load factor fell by 1.9 percentage points to 70.3% compared to March 2023.
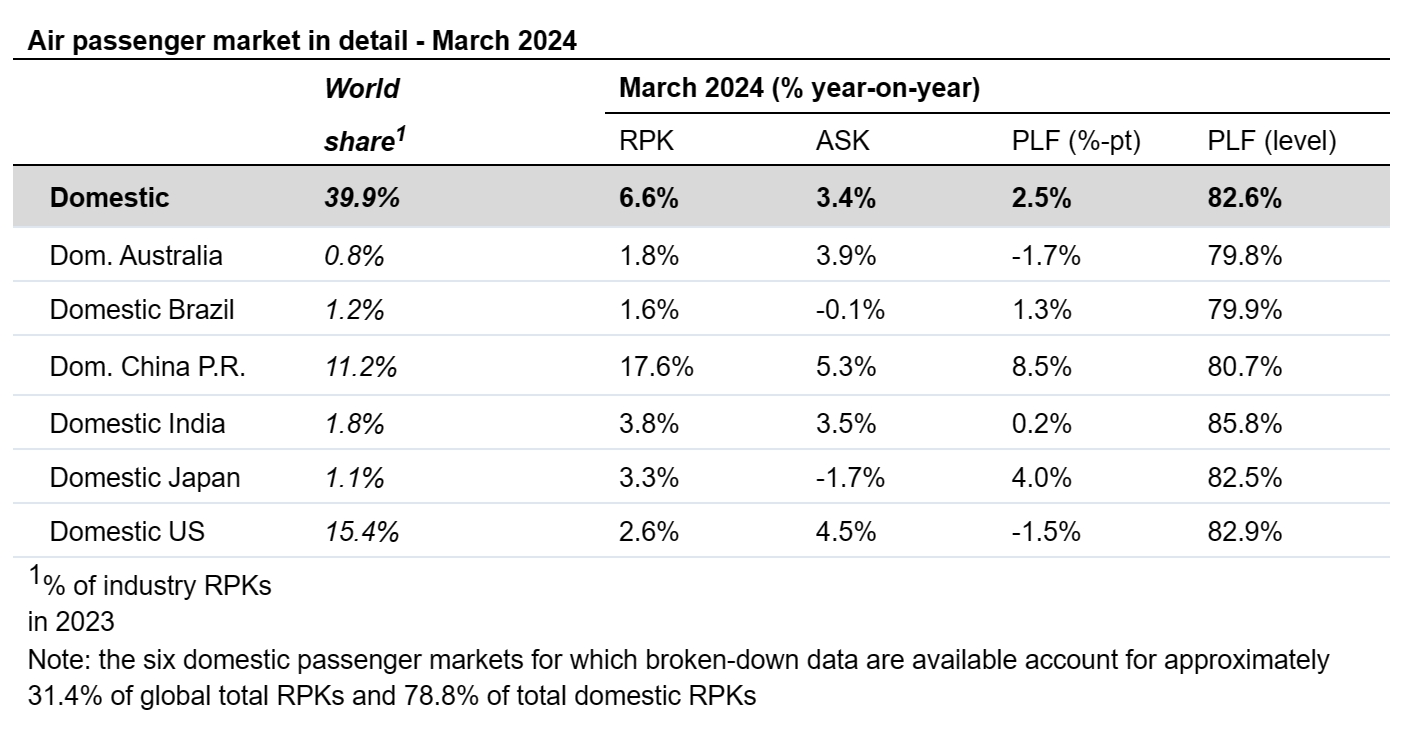
Domestic markets
Domestic demand showed slower growth in March, returning to typical pre-pandemic growth rates. China continued to be the leading market with a 17.6% increase compared to March 2023. However, other markets showed stable growth, with the exception of Australia, where the drop in growth may reflect the wider economic slowdown in the country in Q1.