
We have been advised not to bring our mobile gadgets to bed as the blue light emitted is bad for our eyesight, interrupts our sleep patterns and bad for health, yet many travellers in Asia Pacific (APAC) are doing just that – consuming travel content before they hit the sack.
Skyscanner’s first-ever Travel Content Survey tevealed one in three APAC travellers read or watch travel-related content before they turned in. Exceptions are Singaporeans and Indians – former (49%) preferred to do it on-the-go while the latter (37%) at work or in school.
The global travel search engine said travel inspiration was a key reason why 39% of the over 8,000 respondents across 10 APAC countries consume travel content.
The study, which looked into the travel related content preferences and behaviours in APAC, said content search was also to discover travel hacks and tips (33%).
Indonesians placed finding travel deals (45%) on par with travel inspiration (45%) in their search, while for the Koreans (44%) and Taiwanese (40%) it was to learn travel hacks and tips.
Photo galleries are the format that most inspired travel. One in four respondents said these would motivate them to travel more than any other content format, citing as examples ‘top 10 lists’ (21%), feature articles (19%) and travel city guides (18%).
While 84% of APAC respondents seek out travel content on social platforms compared to other channels, less than a quarter (22%) would definitively share a post on their social networks.
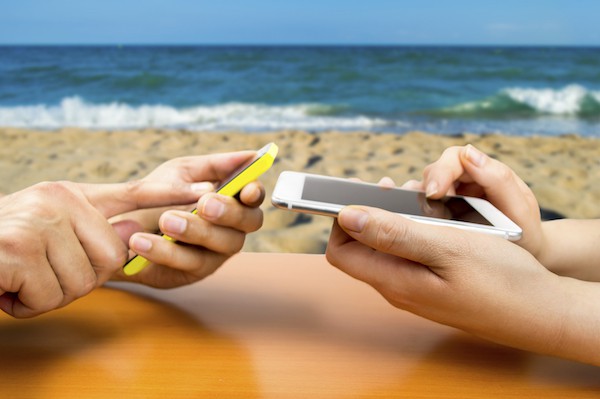
Men more likely to share content than women. (Image credit: Manuel-Faba-Ortega/iStock)
The survey also found that men are more likely to share content than women (61% vs 40%).
“To better understand smart travellers of today the Skyscanner Travel Content Survey seeks to uncover insights into their preferences and habits, from their content consumption patterns to their travel must-dos, across the Asia Pacific region,” says Gavin Harris, senior manager for Skyscanner Singapore.
By uncovering these preferences and behaviours the travel site could provide localised and relevant content to help travellers better plan their holidays, he added.
Some takeaways from the survey (details in infographic below):
- APAC travellers like to experience the destination like a local – with adventure and nature favoured by Indian, Indonesian, Filipino and Thai travellers.
- Social media platforms – Facebook, Instagram, Twitter, Snapchat – are the most popular medium for respondents to find travel content (84%), and are especially popular among Indonesian (91%), Thai (85%) and Singaporean (89%) travellers.
- Filipinos (83%) and Indonesians (95%) are the most social compared to their Asian counterparts, and are likely share travel content on their social networks.
- Australian (37%), Korean (28%), Hong Kong (32%) and Taiwanese (31%) travellers are the least inclined to share anything.
- Travel research is done more on mobile devices (51%) than desktop/laptop (42%), with only 7% using a tablet.
- Desktop/laptop usage is more popular than mobile devices for Australians (59% vs 24%), while Koreans and Filipinos prefer using mobile phones for travel research over desktop/laptop (68% vs 29% and 61% vs 30% respectively).
- The mobile phone is the preferred device for men (62%) for holiday research, women do theirs on desktops or laptops (46%).

• Featured image credit: DragonImages/iStock